Objective 10.1: Compare and Contrast Tools Available for Troubleshooting
Capture and trace uplink, vmknic, and physical NIC packets
The pktcap-uw tool is an enhanced packet capture and analysis tool that can be used in place of the legacy tcpdump-uw tool. The pktcap-uw tool is included by default in ESXi 5.5 and later versions. This article provides information on using the pktcap-uw tool for packet capture and analysis.
Source: https://kb.vmware.com/s/article/2051814
Use the pktcap-uw utility to view the path of a packet in the network stack on an ESXi host for latency analysis:
pktcap-uw –trace filter_options output_control_options
filter options:
- VLAN ID
- VXLAN ID
- L3 protocols
- TCP port
Output control options:
- {-o | –outfile} pcap_file: save captured trace into PCAP format file
- -P|–ng option PCAPNF format
- –cosole : print output in console (default option)
- {-c | –count} number_of_packets
- {-s | –snaplen} snapshot_length Capture only the first snapshot_length bytes from each packet.
- -h view help
The filter options for pktcap-uw are valid when you capture and trace packets. For information about the command syntax of the pktcap-uw utility audit NSX infrastructure changes:
- –srcmac mac_address : source MAC address
- –dstmac mac_address : destination MAC address
- –mac mac_address : source or dest mac address
- –ethtype 0x Ethertype : Capture or trace packets at Layer 2 according to the next level protocol that consumes packet payload. Example for LLDP: –ethtype 0x88CC
- –vlan VLAN_ID
- –srcip IP_addess | IP_address/subnet_range
- –dstip IP_addess | IP_address/subnet_range
- –ip IP_addess
- –proto 0xIP protocol_number : Capture or trace packets at Layer 3 according to the next level protocol that consumes the payload. For example, to monitor traffic for the UDP protocol, type –proto 0x11
- –srcport source_port
- –dstport destination_port
- –tcpport TCP_port
- –vxlan VXLAN_ID
Source: https://docs.vmware.com/en/VMware-vSphere/6.0/vsphere-esxi-vcenter-server-602-networking-guide.pdf
Capture Packets That Arrive at a Physical Adapter
Monitor host traffic related to the external network by capturing packets at certain points in the path between a vSphere Standard Switch or vSphere Distributed Switch and a physical adapter
Procedure:
- (Optional) Find the name of the physical adapter that you want to monitor in the host adapter list
- In the ESXi Shell to the host, run the pktcap-uw command with the –uplink vmnicX argument and with options to monitor packets at a particular point, filter captured packets and save the result to a file.
- pktcap-uw –uplink vmnicX [–capture capture_point|–dir 0|1] [filter_options] [–outfile pcap_file_path[–ng]] [–count number_of_packets]
- It is possible to specify another capture point:
- –capture UplinkSnd(Transmitted packets)
- –capture UplinkRcv(Received packets)
- –dir 1 (Monitor packets that leave the virtual switch.)
- –dir 0 (Monitor packets that enter the virtual switch.)
- If you have not limited the number of packets by using the –count option, press Ctrl+C to stop capturing or tracing packets
- Example: pktcap-uw –uplink vmnic0 –capture UplinkRcv –srcip 192.168.25.113 –outfile vmnic0_rcv_srcip.pcap –count 60
Source: https://docs.vmware.com/en/VMware-vSphere/6.0/vsphere-esxi-vcenter-server-602-networking-guide.pdf
Capture Packets for a VMXNET3 Virtual Machine Adapter
Monitor traffic that flows between a virtual switch and a VMXNET3 virtual machine adapter by using the pktcap-uw utility. (Only for VMXNET3 virtual nic)
Procedure:
- In the host, learn the port ID of the virtual machine adapter by using the esxtop utility
- In the ESXi Shell to the host, run pktcap-uw –switchport port_ID
- n the ESXi Shell to the host, run the pktcap-uw command with the –switchport port_ID argument and with options to monitor packets at a particular point, filter captured packets and save the result to a file:
- pktcap-uw –switchportport_ID [–capture capture_point|–dir 0|1 –stage 0|1] [filter_options] [–outfile pcap_file_path[–ng]] [–count number_of_packets]
- It is possible to specify another capture point:
- –capture Vmxnet3Tx (Transmitted packets)
- –capture Vmxnet3Rx (Received packets)
- –dir 1 –stage 0 (Immediatly after they leave the virtual switch)
- –dir 1 (before thay enter the virtual machine)
- –dir 0 –stage 1 (after they enter the virtual switch)
- Example: pktcap-uw –switchport 33554481 –capture Vmxnet3Rx –srcip 192.168.25.113 –outfile vmxnet3_rcv_srcip.pcap –count 60
Source: https://docs.vmware.com/en/VMware-vSphere/6.0/vsphere-esxi-vcenter-server-602-networking-guide.pdf
Capture Packets for a VMkernel Adapter
Monitor packets that are exchanged between a VMkernel adapter and a virtual switch by using the pktcap-uw utility
Procedure:
- (Optional) Find the name of the VMkernel adapter that you want to monitor in the VMkernel adapter list
- the ESXi Shell to the host, run the pktcap-uw command with the –vmk vmkX argument and with options to monitor packets at a particular point,
filter captured packets and save the result to a file.- pktcap-uw –vmk vmkX [–capture capture_point|–dir 0|1 –stage 0|1] [filter_options] [–outfile pcap_file_path[–ng]] [–count number_of_packets]
- It is possible to specify another capture point:
-
–dir 1 –stage 0 (Monitor packets immediately after they leave the virtual switch)
- –dir 1 (Monitor packets immediately before they enter the VMkernel adapter)
- –dir 0 –stage 1 (Monitor packets immediately before they enter the virtual switch)
-
Source: https://docs.vmware.com/en/VMware-vSphere/6.0/vsphere-esxi-vcenter-server-602-networking-guide.pdf
Mirror network traffic for analysis
Port mirroring allows you to mirror a distributed port’s traffic to other distributed ports or specific physical switch ports. Port mirroring is used on a switch to send a copy of packets seen on one switch port (or an entire VLAN) to a monitoring connection on another switch port. Port mirroring is used to analyze and debug data or diagnose errors on a network.
Create a Port Mirroring Session:
- Select Port Mirroring Session Type
- Browse to a distributed switch in the vSphere Web Client navigator
- Click the Manage tab and select Settings > Port Mirroring
- Click New
- Select the session type for the port mirroring session:
- Distributed Port Mirroring
- Remote Mirroring Source
- Remote Mirroring Destination
- Encapsulated Remote Mirroring (L3) Source
- Distributed Port Mirroring (legacy)
- Specify Port Mirroring Name and Session Details
- set the session properties. Different options are available for configuration depending on which session type you selected:
- Name
- Status
- Session Type
- Nomral I/O on destination ports
- Mirrored packet length (Bytes)
- Sampling rate
- Description
- set the session properties. Different options are available for configuration depending on which session type you selected:
- Select Port Mirroring Sources
- Select the source of the traffic to be mirrored and the traffic direction. Options:
- Add existing ports from a list
- Add existing ports by port number
- Set the traffic direction
- Specify the source VLAN
- Select the source of the traffic to be mirrored and the traffic direction. Options:
- Select Port Mirroring Destinations and Verify Settings
- To complete the creation of a port mirroring session, select ports or uplinks as destinations for the port mirroring session
- Select the destination for the port mirroring session:
- Select a destination distributed port
- Select an uplink
- Select ports or uplinks
- Specify IP address
- Click Next
- Review the information that you entered for the port mirroring session on the Ready to complete page.
- Click Finish
Source: https://docs.vmware.com/en/VMware-vSphere/6.0/vsphere-esxi-vcenter-server-602-networking-guide.pdf
Perform a network health check
The health check support in vSphere Distributed Switch 5.1 and later helps you identify and troubleshoot configuration errors in a vSphere Distributed Switch.
Configuration Errors:
-
The VLAN trunk ranges configured on the distributed switch do not match the trunk ranges on the physical switch -> Checks whether the VLAN
settings on the distributed switch match the trunk port configuration on the connected physical switch ports. -
The MTU settings on the physical network adapters, distributed switch,and physical switch ports do not match -> Checks whether the physical access switch port MTU jumbo frame setting based on per VLAN matches the vSphere distributed switch MTU setting.
-
The teaming policy configured on the port groups does not match the policy on the physical switch port-channel ->Checks whether the connected access ports of the physical switch that participate in an EtherChannel are paired with distributed ports whose teaming policy is IP hash.
Enable Procedure:
- In the vSphere Web Client, navigate to the distributed switch.
-
From the Actions menu, select Settings > Edit Health Check
-
Use the drop-down menus to enable or disable health check options
- VLAN and MTU: Reports the status of distributed uplink ports and VLAN ranges.
- Teaming and Failover: Checks for any configuration mismatch between theESXi host and the physical switch used in the teaming policy
Objective 10.2: Troubleshoot Common NSX Installation/Configuration Issues
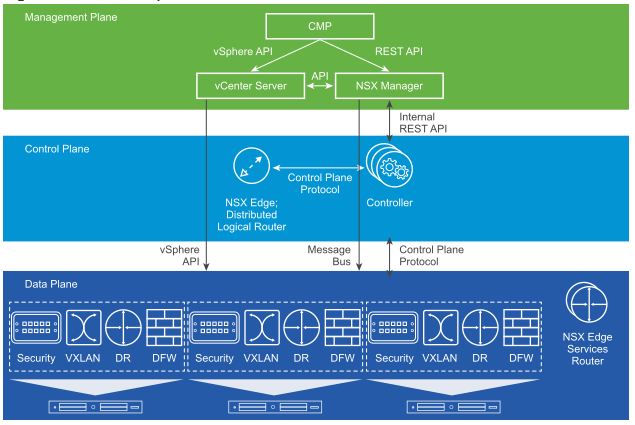
The control-plane communication between NSX Manager and ESXi hypervisor hosts is provided by a RabbitMQ-based messaging service. The control-plane communication between the Controller cluster and ESXi hypervisor hosts depends on a netcpa userworld agent that runs on hosts as a client.
Troubleshoot vCenter Server link
Common Issues Related to Connecting NSX Manager to vCenter Server:
-
DNS incorrectly configured on NSX Manager, vCenter Server, or an ESXi host.
-
NTP incorrectly configured on NSX Manager, vCenter Server, or an ESXi host.
-
User account without vCenter role of Administrator used to connect NSX Manager to vCenter.
-
Network connectivity issues between NSX Manager and vCenter server.
-
User logging into vCenter with an account that does not have a role on NSX Manager.
Verify:
- To verify connectivity, ping from the NSX virtual appliance and view the ARP and routing tables:
- show arp
- show ip route
- Look for errors in the NSX Manager log to indicate the reason for not connecting to vCenter Server.
- Log in to the NSX Manager CLI console, run the command: debug connection IP_of_ESXi_or_VC, and examine the output.
- Perform Packet Capture on NSX Manager to View Connections: debug packet display interface mgmt port_80_or_port_443
- Verify Network Configuration on NSX Manager: show running-config
- NSX Manager supports two ways to generate certificates: NSX Manager generated CSR: Limited functionality due to basic CSR and PKCS#12: This is recommended for production. There is a known issue in which the CMS silently fails to make API calls. Look for errors in the NSX Manager log to indicate the reason for not connecting to vCenter Server. The command to view the log is show log manager follow. To resolve this issue, use a browser to navigate to the NSX Manager IP address or hostname and accept the certificate.
Troubleshoot host preparation issues
The deployment on hosts requires that DNS be configured on the hosts, vCenter Server, and NSX Manager. Deployment does not require an ESXi host reboot, but any update or removal of VIBs requires an ESXi host reboot.
Common issues:
- EAM fails to deploy VIBs
- A previous VIB of an older version is already installed. This requires user intervention to reboot hosts.
- Check communication channel health for the host
- Check vSphere ESX Agent Manager for errors in vCenter home > Administration > vCenter Server Extensions > vSphere ESX Agent Manager
- On the host that is having an issue, run the tail /var/log/esxupdate.log command.
- NSX Manager and vCenter Server experience communication issues
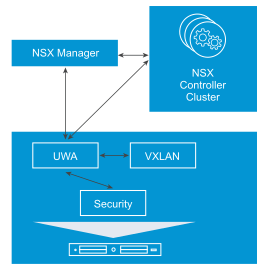
Host Preparation (UWA) Troubleshooting: NSX Manager configures two user world agents on all hosts in a cluster (Messaging bus UWA (vsfwd) Control plane UWA (netcpa))
In rare cases, the installation of the VIBs succeeds but for some reason one or both of the user world agents is not functioning correctly. This could manifest itself as:
- The firewall showing a bad status.
- The control plane between hypervisors and the Controllers being down. Check NSX Manager System Events.
Resolution: check the status of message bus service on NSX Manager Appliance web UI under the Summary tab. If RabbitMQ is stopped, restart it.
Objective 10.3: Troubleshoot Common NSX Component Issues
Differentiate NSX Edge logging and troubleshooting commands
To troubleshoot issues with an NSX Edge appliance, validate that each troubleshooting step below is true for your environment. Each step provides instructions or a link to a document, to eliminate possible causes and take corrective action as necessary. The steps are ordered in the most appropriate sequence to isolate the issue and identify the proper resolution. Do not skip a step.
Installation and Upgrade issues:
- Verify that the issue you are encountering is not related to the “Would Block” issue
- If the upgrade or redeploy succeeds but there is no connectivity for the Edge interface, verify connectivity on the back-end Layer 2 switch
- If deployment or upgrade of the Edge fails with the error or If the deployment or upgrade succeeds, but there is no connectivity on the Edge interfaces investigate the host switch.
Configuration issue:
- Collect the NSX Edge diagnostic information
Firewall Issues:
- If there are inactivity time-out issues and you are noticing that applications are idle for a long time, increase inactivity-timeout settings using the REST API
Edge Firewall Packet Drop Issues:
- Check the firewall rules table with the show firewall command. The usr_rules table displays the configured rules.
- Collect the show ipset command output
- Enable logging on a particular firewall rule using the REST API or the Edge user interface, and monitor the logs with the show log follow command (If logs are not seen, enable logging on the DROP Invalid rule using the following REST API)
- Check for matching connections in the Edge firewall state table with the show flowtable rule_id command
- Compare the active connection count and the maximum allowed count with the show flowstats command
- Check the Edge logs with the show log follow command, and look for any ALG drops. Search for strings similar to tftp_alg, msrpc_alg, or oracle_tns.
Edge Diagnosis:
- Check if vmtoolsd is running with show process list
- Check if Edge is in a good state by running show eventmgr
Message Bus Debugging:
- The Message Bus is used for NSX Edge communication when ESXi hosts are prepared. When you encounter issues, the NSX Manager logs might contain “Error: RPC request timed out”
- Reasons:
- Edge is in a bad state
- Message Bus connection is broken
- Diagnosis:
- check rmq connectivity with show messagebus messages
- check vmci connectivity with show messagebus forwarder
- in ESXi host, check if the ESXi host connects to the RMQ broker with esxcli network ip connection list (grep port 5671)
Packet drop statistics ->
- Starting with NSX for vSphere 6.2.3, you can use the command show packet drops to displays packet drop statistics for the following:
- Interface
- Driver
- L2
- L3
- Firewall
- To run the command, log in to the NSX Edge CLI and enter basic mode: show packet drops
Verify NSX Controller cluster status and roles
- List all the hosts in the cluster to get the host IDs -> show cluster CLUSTER-ID
- Check controller cluster status -> show control-cluster status
- View list of nodes in the cluster-> show control-cluster startup-nodes
- To restart the controller process-> restart controller
- To reboot the controller node -> restart system
Verify NSX Controller node connectivity
During the deployment of NSX Controllers, the typical issues that can be encountered are as follows:
- NSX Controller running slowly. This might be caused by insufficient resources. To detect issues with NSX Controller system requirements, run the request system compatibility-report command
- IP connectivity issues between the NSX Manager and the NSX controllers. This is generally caused by physical network connectivity issues or a firewall blocking communication
- A misbehaving “rogue” Controller or an upgraded Controllers in the Disconnected state
- DNS on ESXi hosts and NSX manager have not been configured properly.
- NTP on ESXi hosts and NSX Manager are not in sync
- When newly connected VMs have no network access, this is likely caused by a control-plane issue. Check the Controller status (Also try running the esxcli network vswitch dvs vmware vxlan network list –vds-name <name> command on ESXi hosts to check the control-plane status. Note that the Controller connection is down)
In case of an NSX Controller failure, you may still have two controllers that are working. The cluster majority is maintained, and the control plane continues to function. Even so, it is important to delete all three controllers and add new ones, so as to maintain a fully functional three-node cluster.
Check NSX Controller API service
For the unicast or hybrid control plane mode, you must add an NSX controller to manage overlay transport and provide East-West routing. The controller optimizes virtual machine broadcast (ARP only) traffic, and the learning is stored on the host and the controller.
Query Controllers -> Retrieves details and runtime status for controller. Runtime status can be one of the following:
- Deploying ‐ controller is being deployed and the procedure has not completed yet.
- Removing ‐ controller is being removed and the procedure has not completed yet.
- Running ‐ controller has been deployed and can respond to API invocation.
- Unknown ‐ controller has been deployed but fails to respond to API invocation.
Source: https://docs.vmware.com/en/VMware-NSX-for-vSphere/6.2/nsx_62_api.pdf
Validate VXLAN and Logical Router mapping tables
- Verify host has learnt MAC addresses of all VMs -> esxcli network vswitch dvs vmware vxlan network mac list –vds-name Compute_VDS –vxlan-id=5000
- Details of each vmk NIC, including vDS info for VXLAN vmks -> esxcli network ip interface list –netstack=vxlan
- View routing table of VXLAN-dedicated TCP/IP stack -> esxcli network ip route ipv4 list -N vxlan
- View ARP table of VXLAN-dedicated TCP/IP stack -> esxcli network ip neighbor list -N vxlan
- Ping from VXLAN-dedicated TCP/IP stack -> ping ++netstack=vxlan –I vmk1 x.x.x.x
List Logical Router instances and statistics
- Find all the Logical Router Instances -> show control-cluster logical-routers instance all
- View details of each logical router -> show control-cluster logical-routers instance 0x570d4555
Verify Logical Router interface and route mapping tables
- View all the interfaces CONNECTED to the logical route r-> show control-cluster logical-routers interface-summary 0x570d4555
- View all the routes learned by this logical router -> show control-cluster logical-routers routes 0x570d4555